![]()
The NSIDC Web site and data services are currently having intermittent problems and may be unavailable. We are working to restore these services as soon as possible and apologize for any inconvenience this may cause. Please contact NSIDC User Services for assistance.
Read scientific analysis on Arctic sea ice conditions. We provide an update during the first week of each month, or more frequently as conditions warrant.
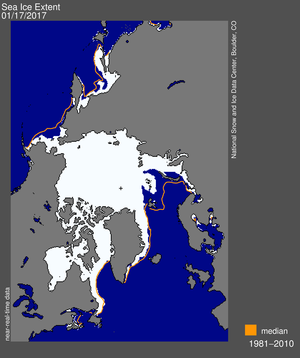
Sea ice data updated daily, with one-day lag. Orange line in extent image (left) and gray line in time series (right) indicate 1981 to 2010 average extent for the day shown. The graph also includes lines for selected earlier years, for comparison. Learn about update delays and other problems which occasionally occur in near-real-time data. Read about the data.
Arctic sea ice extent continued a rapid retreat through the first two weeks of July as a high pressure cell moved over the central Arctic Ocean, bringing higher temperatures. Antarctic sea ice extent increased rapidly through June and early July, and reached new daily record highs through most of this year.
Figure 1. Arctic sea ice extent for July 15, 2014 was 8.33 million square kilometers (3.22 million square miles). The orange line shows the 1981 to 2010 average extent for that month. The black cross indicates the geographic North Pole.
Sea Ice Index data. About the data
Credit: National Snow and Ice Data Center High-resolution image